
Wolfram Alpha the computational search engine makes your life easier by helping you do complex mathematical calculations within seconds. You can differentiate or integrate mathematical functions, do trigonometric calculations, logarithmic calculations etc. Enter any algebraic function and Wolfram Alpha will draw a graph for the function instantly. Wolfram Alpha now is not just limited to plotting graphs on the 2D Cartesian co-ordinates but can also plot 3D graphs.
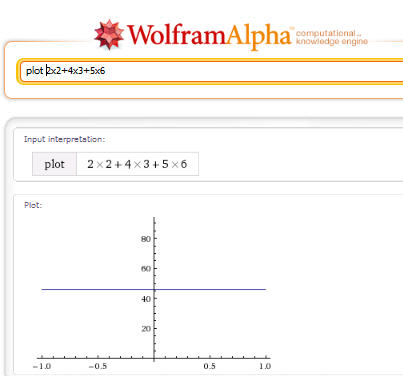
Wolfram Alpha can now plot number lines, 2D and 3D polar plots as well as 2D and 3D parametric plots. You can also have plots for definite integrals, solutions of ordinary differential equations etc. Wolfram Alpha can automatically assume a plot range for bivariate and univariate functions. You can get a simple 2D graph for univariate functions or get 3D graph for bivariate functions. For example, lets take a univariate function:
Now lets take a bivariate function.
For the 3D graphs for bivariate functions, Wolfram Alpha also gives an option to draw mesh lines over the 3D graph or just draw simple lines.