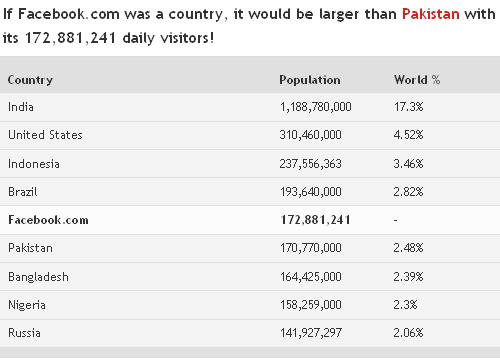
Every webmaster strives to drive more traffic to their blogs. Have you ever wondered how much traffic any blog or website gets everyday? There are many places on the web like Statcounter, Sitemeter etc. where you can have such information. VisualizeTraffict is also lets you have a rough data on the traffic for a site. Visualize traffic has a interesting way of showing the daily traffic to a site. Enter the URL of any site and Visualize Traffic will show the daily traffic data for it. It shows the number of visitors to a site and then helps you visualize it by taking various things into reference. The visitor number is compared with countries or places of the world that have population in the same range as the visitor count for a site. Barcelona Camp Nou’s stadium can house about 100,000 people and based on this fact, Visualize traffic shows as to how many such stadiums are required to house the total visitors to a site.

Visualizetraffic also tells you how long a line would be formed if all those visitors stood hand in hand. You can also get the demographics for a site in terms of the percentage of visitors by country. The Server and Power Consumption information for the server of a certain website gives a visualization of the number of page views handled by the website’s server every second, the number of servers used by it assuming that it uses a standardized server. Then it calculates the total power consumption by the server every year. All these data are really interesting. For Facebook, VisualizeTraffic shows this under Server & Power Consumption Information:
The average Facebook.com visitor visits about 12.91 pages before leaving again, this means that their servers handle about 2,231,896,821 page views per day and in term a total of 25,832 page views per second.
We estimate that this website uses 5,763 server(s), and with the average internet server using about 2,400 kWh of electricity per year, Facebook.com will use more or less 12,000 kWh of power in that time span. Looking at the average cost of 0,17c per kWh, this website uses an estimated total of $2,040 USD on electricity per year.
What Visualizetraffic does is, it just gives you the visitor count to a site and then helps you visualize it by comparing with different entities. Although you cannot be sure about the traffic data generated by Visualizetraffic, you can get an idea of how big a site is in terms of traffic.
